Technical analysis on cryptocurrency – Introduction
Traders can use different tools and techniques that will allow them to analyze cryptocurrencies bids and achieve good results while trading.
These are ways of not shooting in the dark: not investing, trading or selling without having a good parameter of how things are going, and how they can go to a certain crypto.
In this article, we’ll teach you what technical analysis cryptocurrency is; what its major fundamentals are, and what it wants to show us!
Technical analysis on cryptocurrency – What does it mean?
Technical analysis on cryptocurrency is one of the popular ways to estimate and predict the price of an asset in the near future. Investors use information to try predicting future digital currency trends.
Usually, it relies on charting or table patterns, and based on them the traders carry out an analysis to try determining future price fluctuations on crypto.
Final results could be different when analysis are made by investors, once there are a lot of types of factors, chat studies and reading for considering while analyzing a chart, even on the same coin.
Besides, cryptocurrency volatility is often high, and that many external factors to it e.g: mentioning of a celebrity – can make crypto prices go up or down, and you will know that, no matter how good the analysis are, it’s never deterministic. In this case, the trader can have just an idea of how it will happen.
Therefore, technical analysis on crypto are always a chart reading of the moment. However, the reading can be affected by external factors of the future.
Candlestick charts
Candlestick charts are one of the most commonly used technical tools to analyze price patterns. In other words, it’s simply a chart composed of individual candles. Candles indicate numbers, fluctuation and maximum and minimum values.
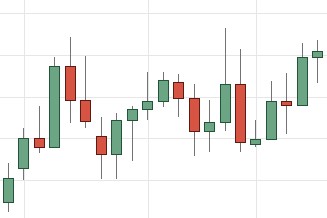
Generally, a candle has three different pieces of information such as: shadow, real body and color (red or green).
- Red candlestick: It represents the falling prices;
- Green candlestick: It represents prices going up.
But the chart reader will decide it.
All types of analysis need to consider a time frame (years time frame, months time frame, daily time frame and so on). It will be possible to see these trends in the time frame and the corresponding asset opening and closing prices will be in the body of the candle.
Support and resistance levels
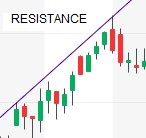
Technical analysis cryptocurrency uses support and resistance levels to identify price points on a chart where the probabilities favor a pause or reversal of a prevailing trend. Support and resistance are the opposite of each other.
For instance:
- Resistance occurs when a value barrier needs to be broken for cryptocurrency price goes up;
- Support occurs when a certain level of value remains as minimum value.
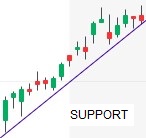
When we analyze crypto history, it’s possible to realize that there are a large number of support and resistance levels. They can also change as time goes by.
Trader and investor view
Charts, tables and calculations can be used by traders and investors. However, it’s essential to understand the difference between traders and investors. Traders buy and sell shares within a single trading day, purchase an asset costing a certain value and sell it more expensively. On the other hand, investors leans towards long-term investment. They look at how certain asset costs, the cryptocurrency price for trading and if the digital currency can increase its price. If all these points are available, then we have a proper opportunity for investing/buying an asset.
In other words, value is related to other factors such as: project development, potential for large-scale use, continual improvement and so on.
There is a tendency for investors to work more in the long term, but traders can also deal with monthly charts and make analysis. Sometimes traders can make a longer time analysis, it will depend which chart time frame they usually work with.

Technical analysis limits
The system analyzed doesn’t have ideal conditions: it’s always changing and transforming. Analysis tries to understand the trend in asset prices, but sometimes it has to change whether adding more data or factors to its calculations.
A single regulatory prohibition on a cryptocurrency causes a lot of charts to fall apart. This is unpredictable or sometimes, it’s possible to have a little idea of how it will work.
Besides, there is an interesting thing: moods are one of the elements into cryptocurrencies prices. If traders bet on a certain crypto, it will raise its price, but if they think that a certain one is not important, it will lower its value. The main point is that the crypto price will fluctuate according to the thought of the participant. Somehow, it can cause an anticipation of prices made by technical analysis.
For instance, using analysis, we can conclude that a certain coin will jump its price in a time frame. It won’t necessarily happen, but the positive vibes allowed a large number of traders to bet on it, that’s why its prices climbed up.
Technical analysis on cryptocurrency – Conclusion
Technical analysis on cryptocurrencies really come in useful, but to make it plain that it’s crucial studying as well as precision in calculations.
Regarding traders, it’s possible that they become investors, but to make it real they need to invest their money from trading in crypto, which might jump its price in the long term.
If you want to learn types of analysis, start following the best analysts known by traders and investors. They will provide you charts studies and important information that will make your analysis better and according to the market oscillation.
Did you like this article? Check out our ECC Project Blog.